
Grafana
Grafana is a complete observability platform for metrics, logs, traces, and dashboards. It offers Prometheus integration, alerting, synthetic testing, and a free tier with enterprise features.
Overview of Grafana
Grafana is a comprehensive observability platform that enables organizations to monitor, analyze, and visualize their infrastructure and application performance data. This powerful tool provides a unified view of metrics, logs, traces, and profiles across your entire technology stack, helping teams identify issues faster and optimize system performance.
With its intuitive dashboard interface and extensive data source integrations, Grafana transforms complex telemetry data into actionable insights for developers, operations teams, and business stakeholders alike. It is widely used in categories such as Network Monitor and Performance Profiler for effective monitoring solutions.
How to Use Grafana
Getting started with Grafana involves connecting your data sources such as Prometheus metrics, Loki logs, Tempo traces, or any of the 20+ supported data source plugins. Once connected, you can create custom dashboards using the drag-and-drop interface or leverage pre-built solutions from the extensive library. Configure alerting rules to notify your team when metrics exceed thresholds, set up service level objectives (SLOs) to track reliability targets, and use the incident management features to coordinate response workflows.
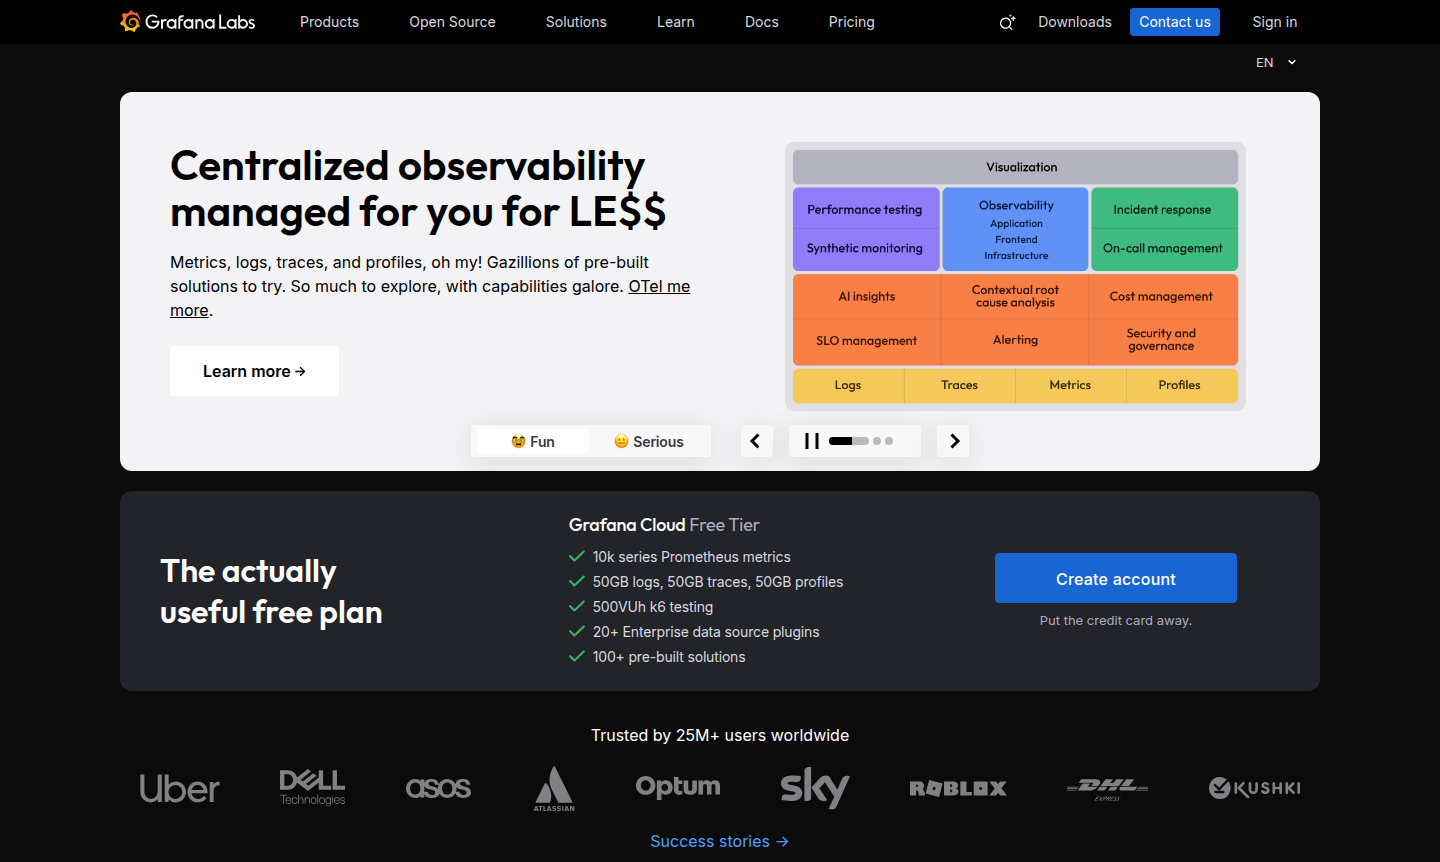
Core Features of Grafana
- Unified Data Visualization – Query and visualize metrics, logs, traces, and profiles in unified dashboards
- Advanced Alerting System – Create, manage, and act on alerts with consolidated views and notification routing
- Performance Testing – Run cloud-based synthetic monitoring and performance tests with k6 integration
- Incident Response Management – Automate incident workflows with on-call scheduling and postmortem analysis
- Cost Optimization – Manage and control observability spend with adaptive telemetry and resource optimization
Use Cases for Grafana
- Infrastructure monitoring for Kubernetes clusters and cloud resources
- Application performance monitoring with distributed tracing
- Business metrics visualization and real-time dashboarding
- Synthetic monitoring for API and web application availability
- Log analysis and correlation with Loki log aggregation
- Service level objective (SLO) management and error budget tracking
- Frontend observability for web application user experience
Support and Contact
For technical support and inquiries, contact the Grafana team at update@grafana.com or visit the official support portal for documentation and community resources.
Company Info
Grafana is developed by Grafana Labs, a leading provider of open and composable operational dashboards. The company specializes in observability solutions that help organizations understand their metrics no matter where they are stored.
Login and Signup
Access your Grafana Cloud account at grafana.com or sign up for the free tier that includes 10k series Prometheus metrics, 50GB logs, 50GB traces, 50GB profiles, and more.
Grafana FAQ
What is Grafana Cloud and how does it differ from open source Grafana?
Grafana Cloud is the managed service offering that includes the full observability stack with additional enterprise features, support, and scalable hosting, while open source Grafana is self-hosted.
How does Grafana integrate with Prometheus for metrics monitoring?
Grafana provides native Prometheus data source support, allowing direct querying, visualization, and alerting on Prometheus metrics with full PromQL compatibility.
What observability capabilities does Grafana offer beyond basic dashboarding?
Grafana provides comprehensive observability including metrics, logs, traces, profiles, synthetic monitoring, alerting, incident management, and SLO tracking in one platform.
How can I access Grafana documentation and community resources?
You can access comprehensive documentation and join the community forums at the official Grafana support portal.
Grafana Pricing
Current prices may vary due to updates
Grafana Cloud Free Tier
Includes 10k series Prometheus metrics, 50GB logs, 50GB traces, 50GB profiles, 500VUh synthetic testing, 20+ Enterprise data source plugins, and 100+
Grafana Reviews0 review
Would you recommend Grafana? Leave a comment